After reading Julia Evan’s blogpost “Monitoring tiny web services”, I got inspired to show others how I monitor my web services, which are, in fact, a bunch of AWS Lambda functions.
I came up with a simple and free solution that has helped me tremendously to fix many bugs already.
Scream-driven development
It’s easy to neglect monitoring, especially in the beginning. In fact, this is what I did for a long time. I offloaded monitoring to a “Scream-driven development”. That is you are fixing a problem only when users are “screaming” about it. This works up to a certain amount of impact which bugs in your services make. You can even survive with it long enough if the web services’ clients have some smart client-side logic, like retrying on errors with exponential backoff etc. But, after some time, I realized that I’d like to know about the problems faster.
Monitoring != alerting
One important caveat, though, is that by “having monitoring” I do not mean that I want to wake up during the night because some of my services crashed. What I want is to know that some of the services misbehaving. If it’s misbehaving “too much”, the users will anyway contact me. So in the end I’m interested only in “subtle” mishaps, that get otherwise unnoticed.
Therefore, I figured that reading logs of my services was the best way for me to figure out if something went wrong. The only thing that was to be done is to figure out how to do it.
Logs in AWS
Overall, if you would be doing things “the AWS way”, logs of your services will eventually end up in the CloudWatch. CloudWatch is an AWS service used for monitoring and alerting. It can monitor all other AWS services, such as EC2, Lambda, Kubernetes etc. Your application can emit metrics, write logs and you can later build dashboards and configure alerting in the AWS Console.
In my case, simply writing to STDOUT from AWS Lambda, caused a log group to be created.
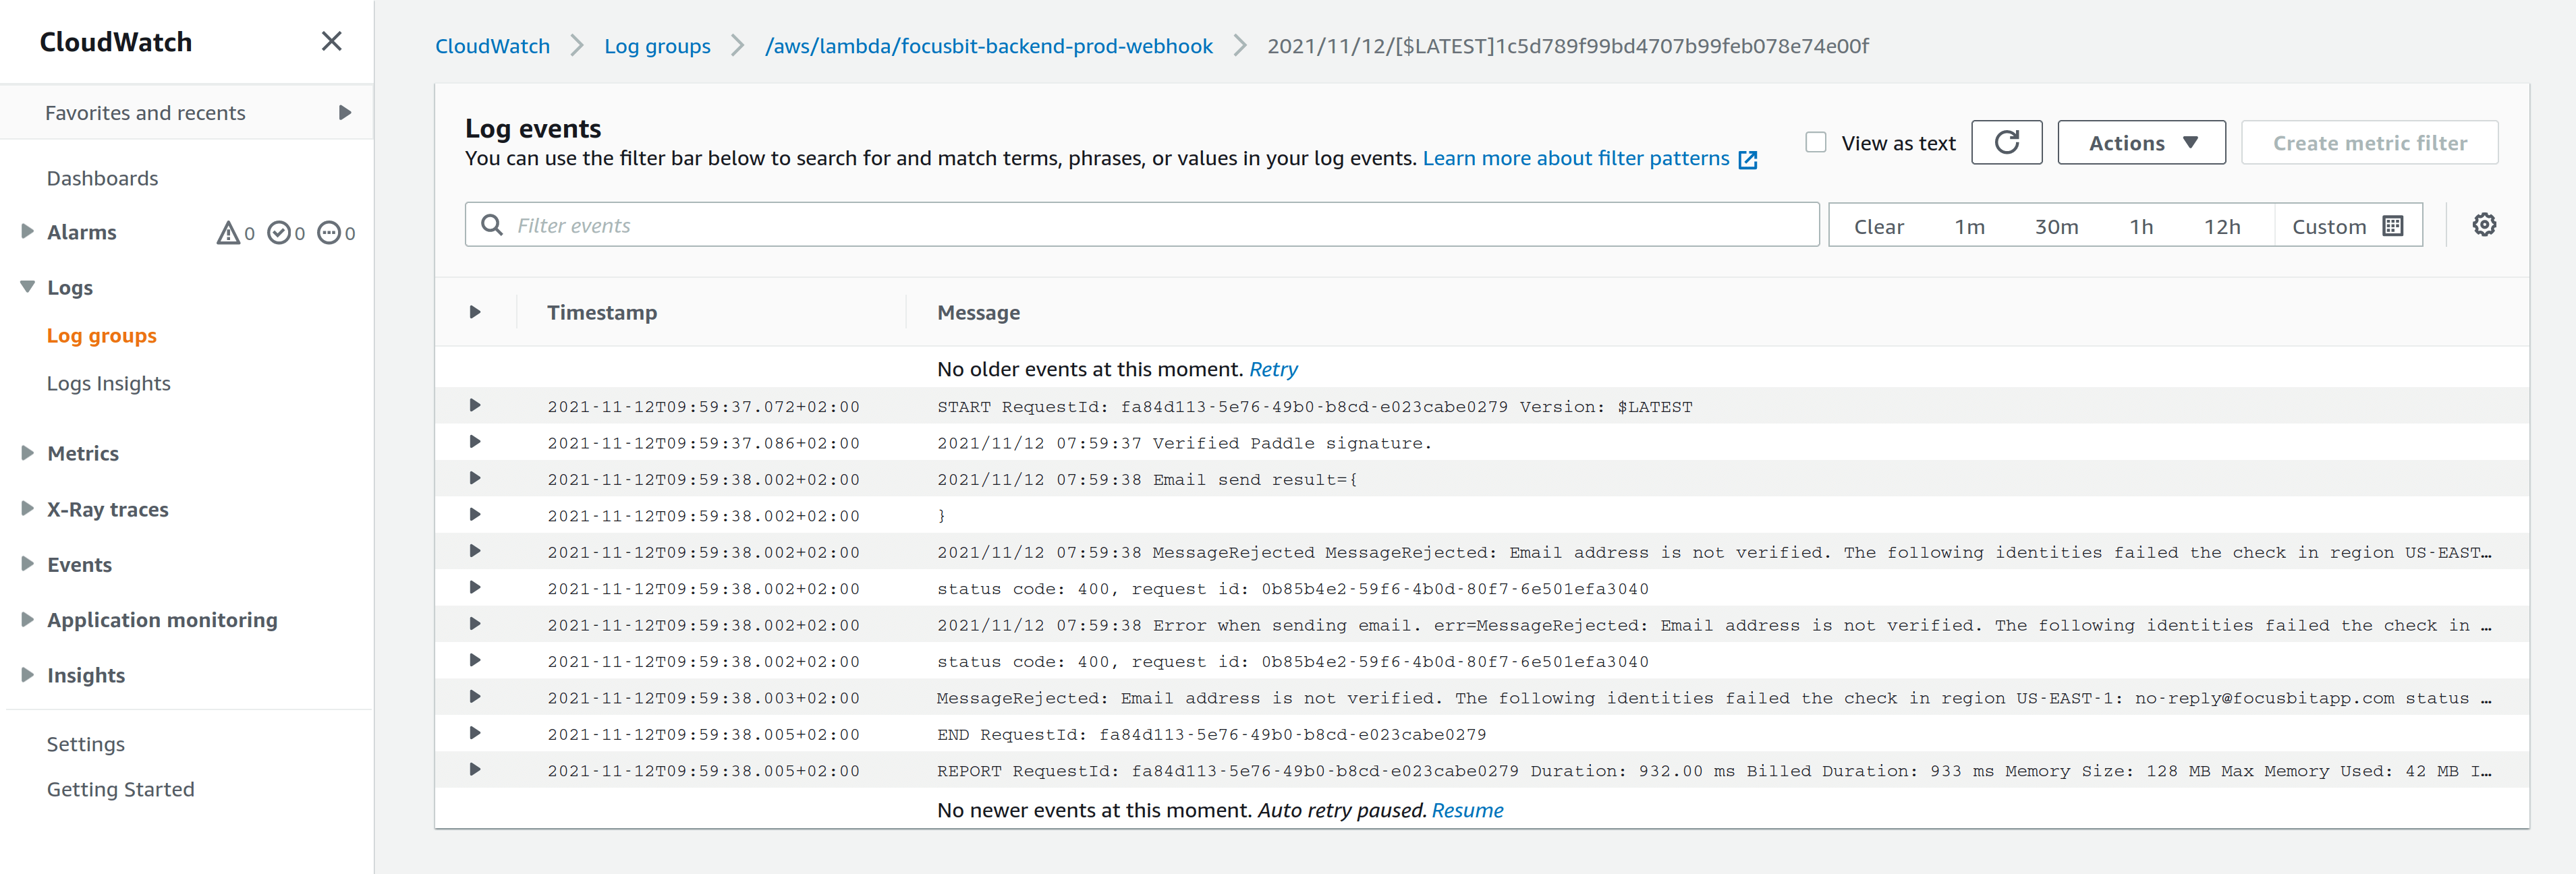 CloudWatch log group
Alerting in AWS
If you’d want to configure alerting on these logs, let’s say if you have string "err=" present in the log line, you would need to create a metric from the log using a filter. Then you would create alerting based on metric value, configure a SNS topic for notifications about alerts and subscribe to that topic via email or SMS.
Now, it does not seem so bad at a first glance, until you know that you have only 10 free metrics allowed and you need to create a metric per log group. AWS want’s you to pay for every sub-sub-feature of any feature you might ever use.
However, it is also simply inconvenient for me. I have many log groups in different stages so that it would be quite annoying to create all these metrics and then configuring monitoring for all of them in the first place.
Solving the problem
After being frustrated with the built-in way to configure alerting, I stopped to think what I actually wanted. And that was to know when errors were in the logs, what were they and how many of those were present. It sounds simple, but I couldn’t find a way to get a holistic picture across all of my log groups in CloudWatch.
After the problem was defined in such way, I knew where should I look for a solution.
Structuring the logs
It became quickly obvious that it’s hard to find all the error messages in CloudWatch, without the “garbage”. The problem was that my logging looked like this:
if value, err := doStuff(); err != nil {
    log.Printf("doStuff() failed! err=%v", err)
}
Now since err could have all sorts of symbols like spaces, quotes etc., there was no standard way to get the full error message when searching in CloudWatch for error messages.
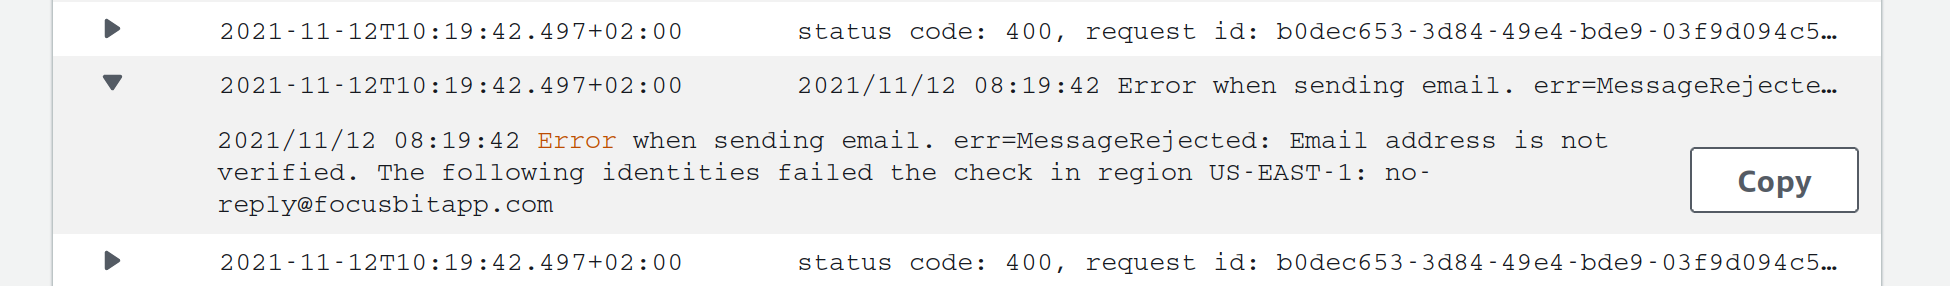 Example of the unstructured error log
However, CloudWatch natively understands few formats of structured logs, namely JSON. Therefore I switched to a structured logging library for Go, like logrus and changed my logging to:
if value, err := doStuff(); err != nil {
    log.WithError(err).Error("doStuff() failed!")
}
What I’d see now in CloudWatch, would be field-by-field parsed logs:
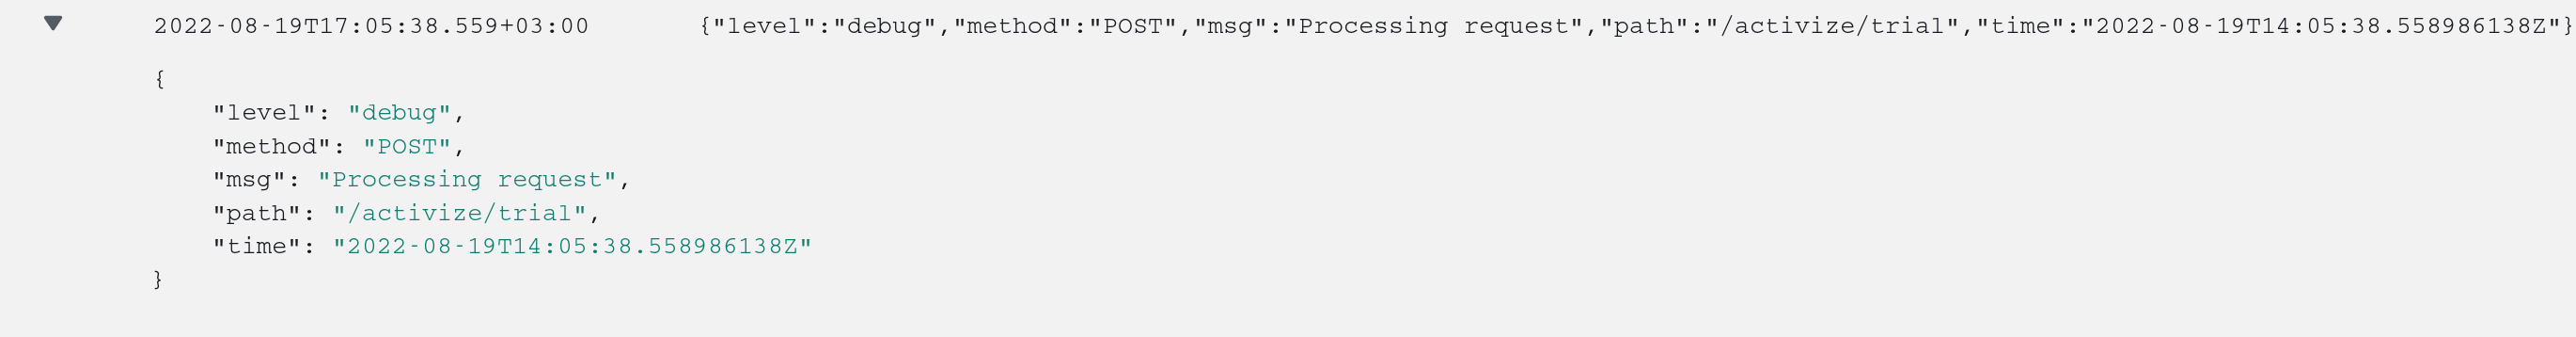 Example of the structured log
Note that this log has a level="debug", msg="ProcessingRequest" and all the custom fields that I cared to add. Now if the level was error, that would mean I’d be able to find all the error messages simply filtering by the level.
Searching the logs
Having structured CloudWatch logs, you can indeed filter and aggregate them using CloudWatch Log Insights.
For example, if I was to find all error logs, I’d go to CloudWatch -> Log Insights and simply run a query filter level = 'error'.
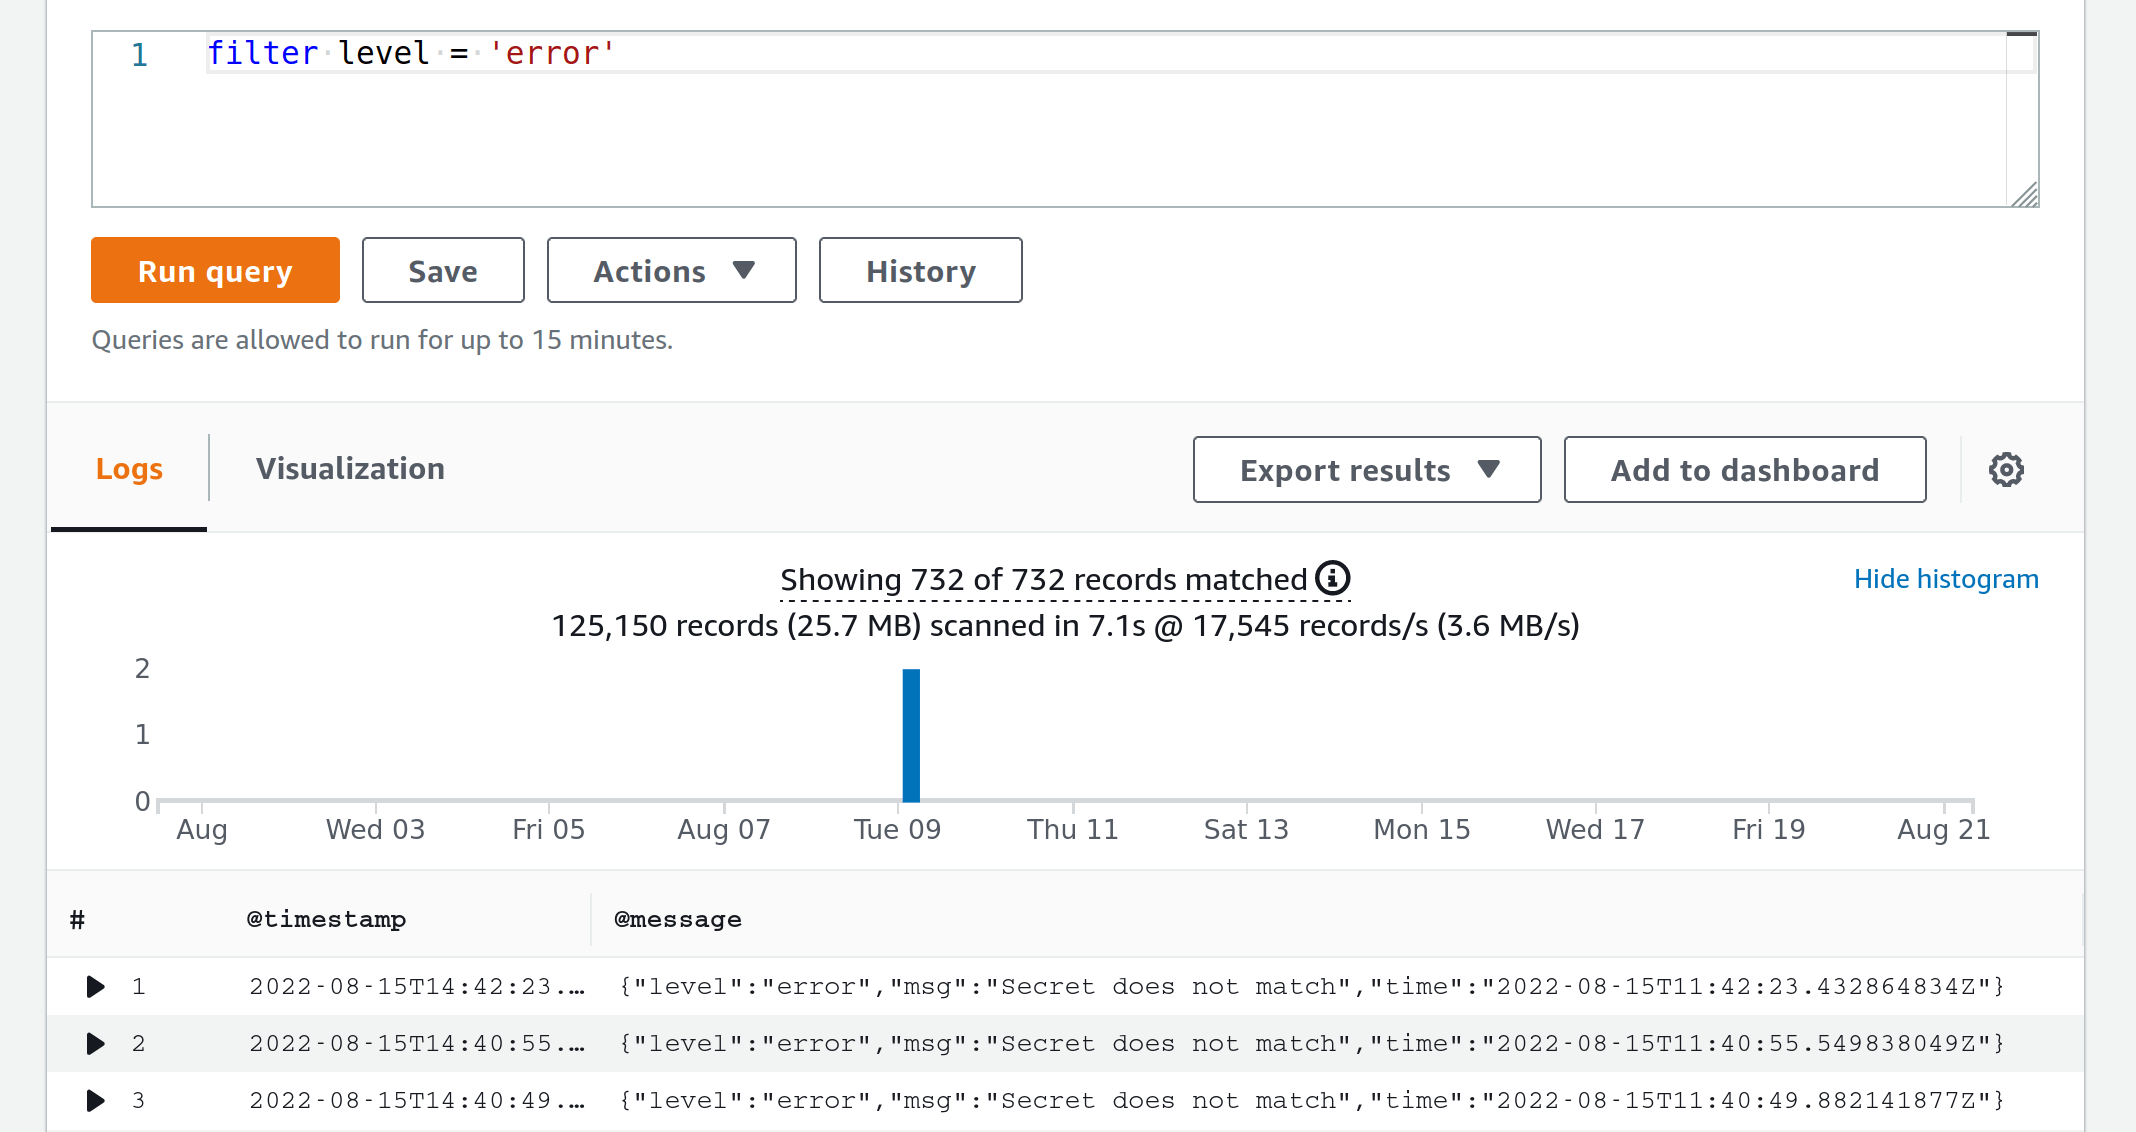 Searching all the error logs
Now we are talking! All error logs right here, at my disposal. Just save the query to the sidebar and don’t forget to log-in to AWS Console every now and again and run it. Right…
Automating the search
Although the search works as intended, what is missing is the automatic notification. Of course I do not have time to login to AWS Console and run the search manually. However, I have time to automate it. Meet CloudWatch Logs Report - yet another small lambda function that does that for you.
It searches through all the log groups using a query and sends an aggregated report to your email:
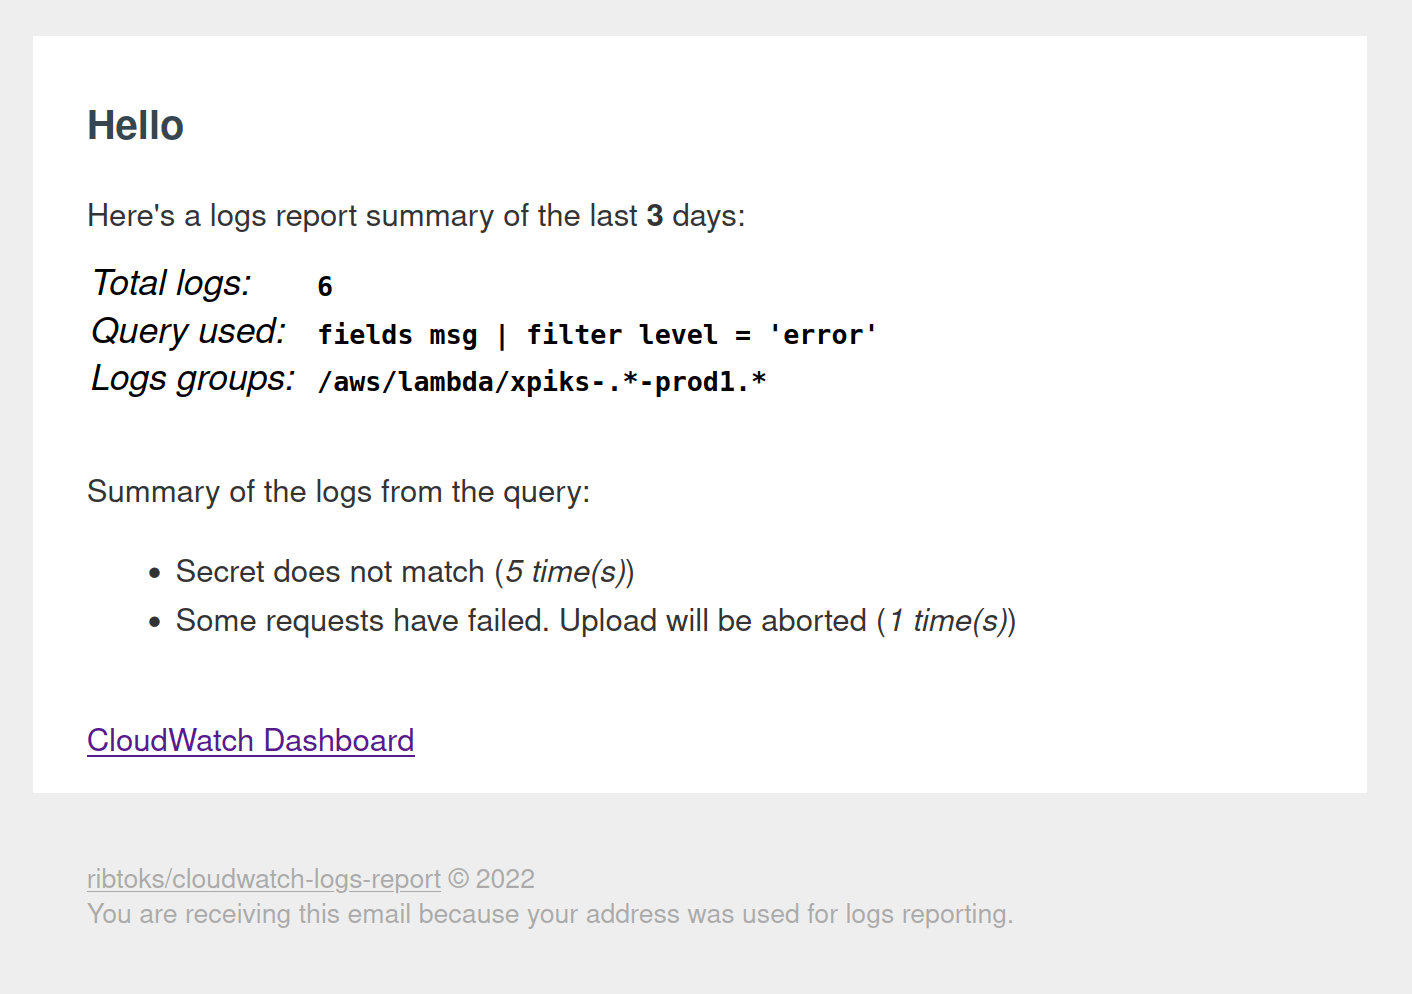 Logs report
Now I’m getting error logs report to my email and no errors get unnoticed!
You can configure the regexp to match the log groups and the search query to use, as well as the cadence you want to receive the reports with. And it’s almost completely free! Depending on the volume of your CloudWatch logs and the interval that the search query needs to scan, you might end up paying some cents (sending an AWS email costs $0.01 at the moment).
Aftermath
Using this system, first of all, requires some discipline with logging. You will need to define what is an error and what is not. It actually took me couple of reports to downgrade certain logging types to “warning” level, knowing that I actually do not want to be notified about them.
This small lambda function that sends error reports, proved to be immensely useful for me. Backend of my services consists mostly of few dozens of lambda functions and thanks to the log reports, I found and fixed few important bugs! Given the 2 mornings I spent creating this function, the payoff absolutely exceeded my expectations.
And how satisfying it is to receive a report that contains "0 logs were found"!